The World in wealth and murder
Gross domestic product vs. Killing rates
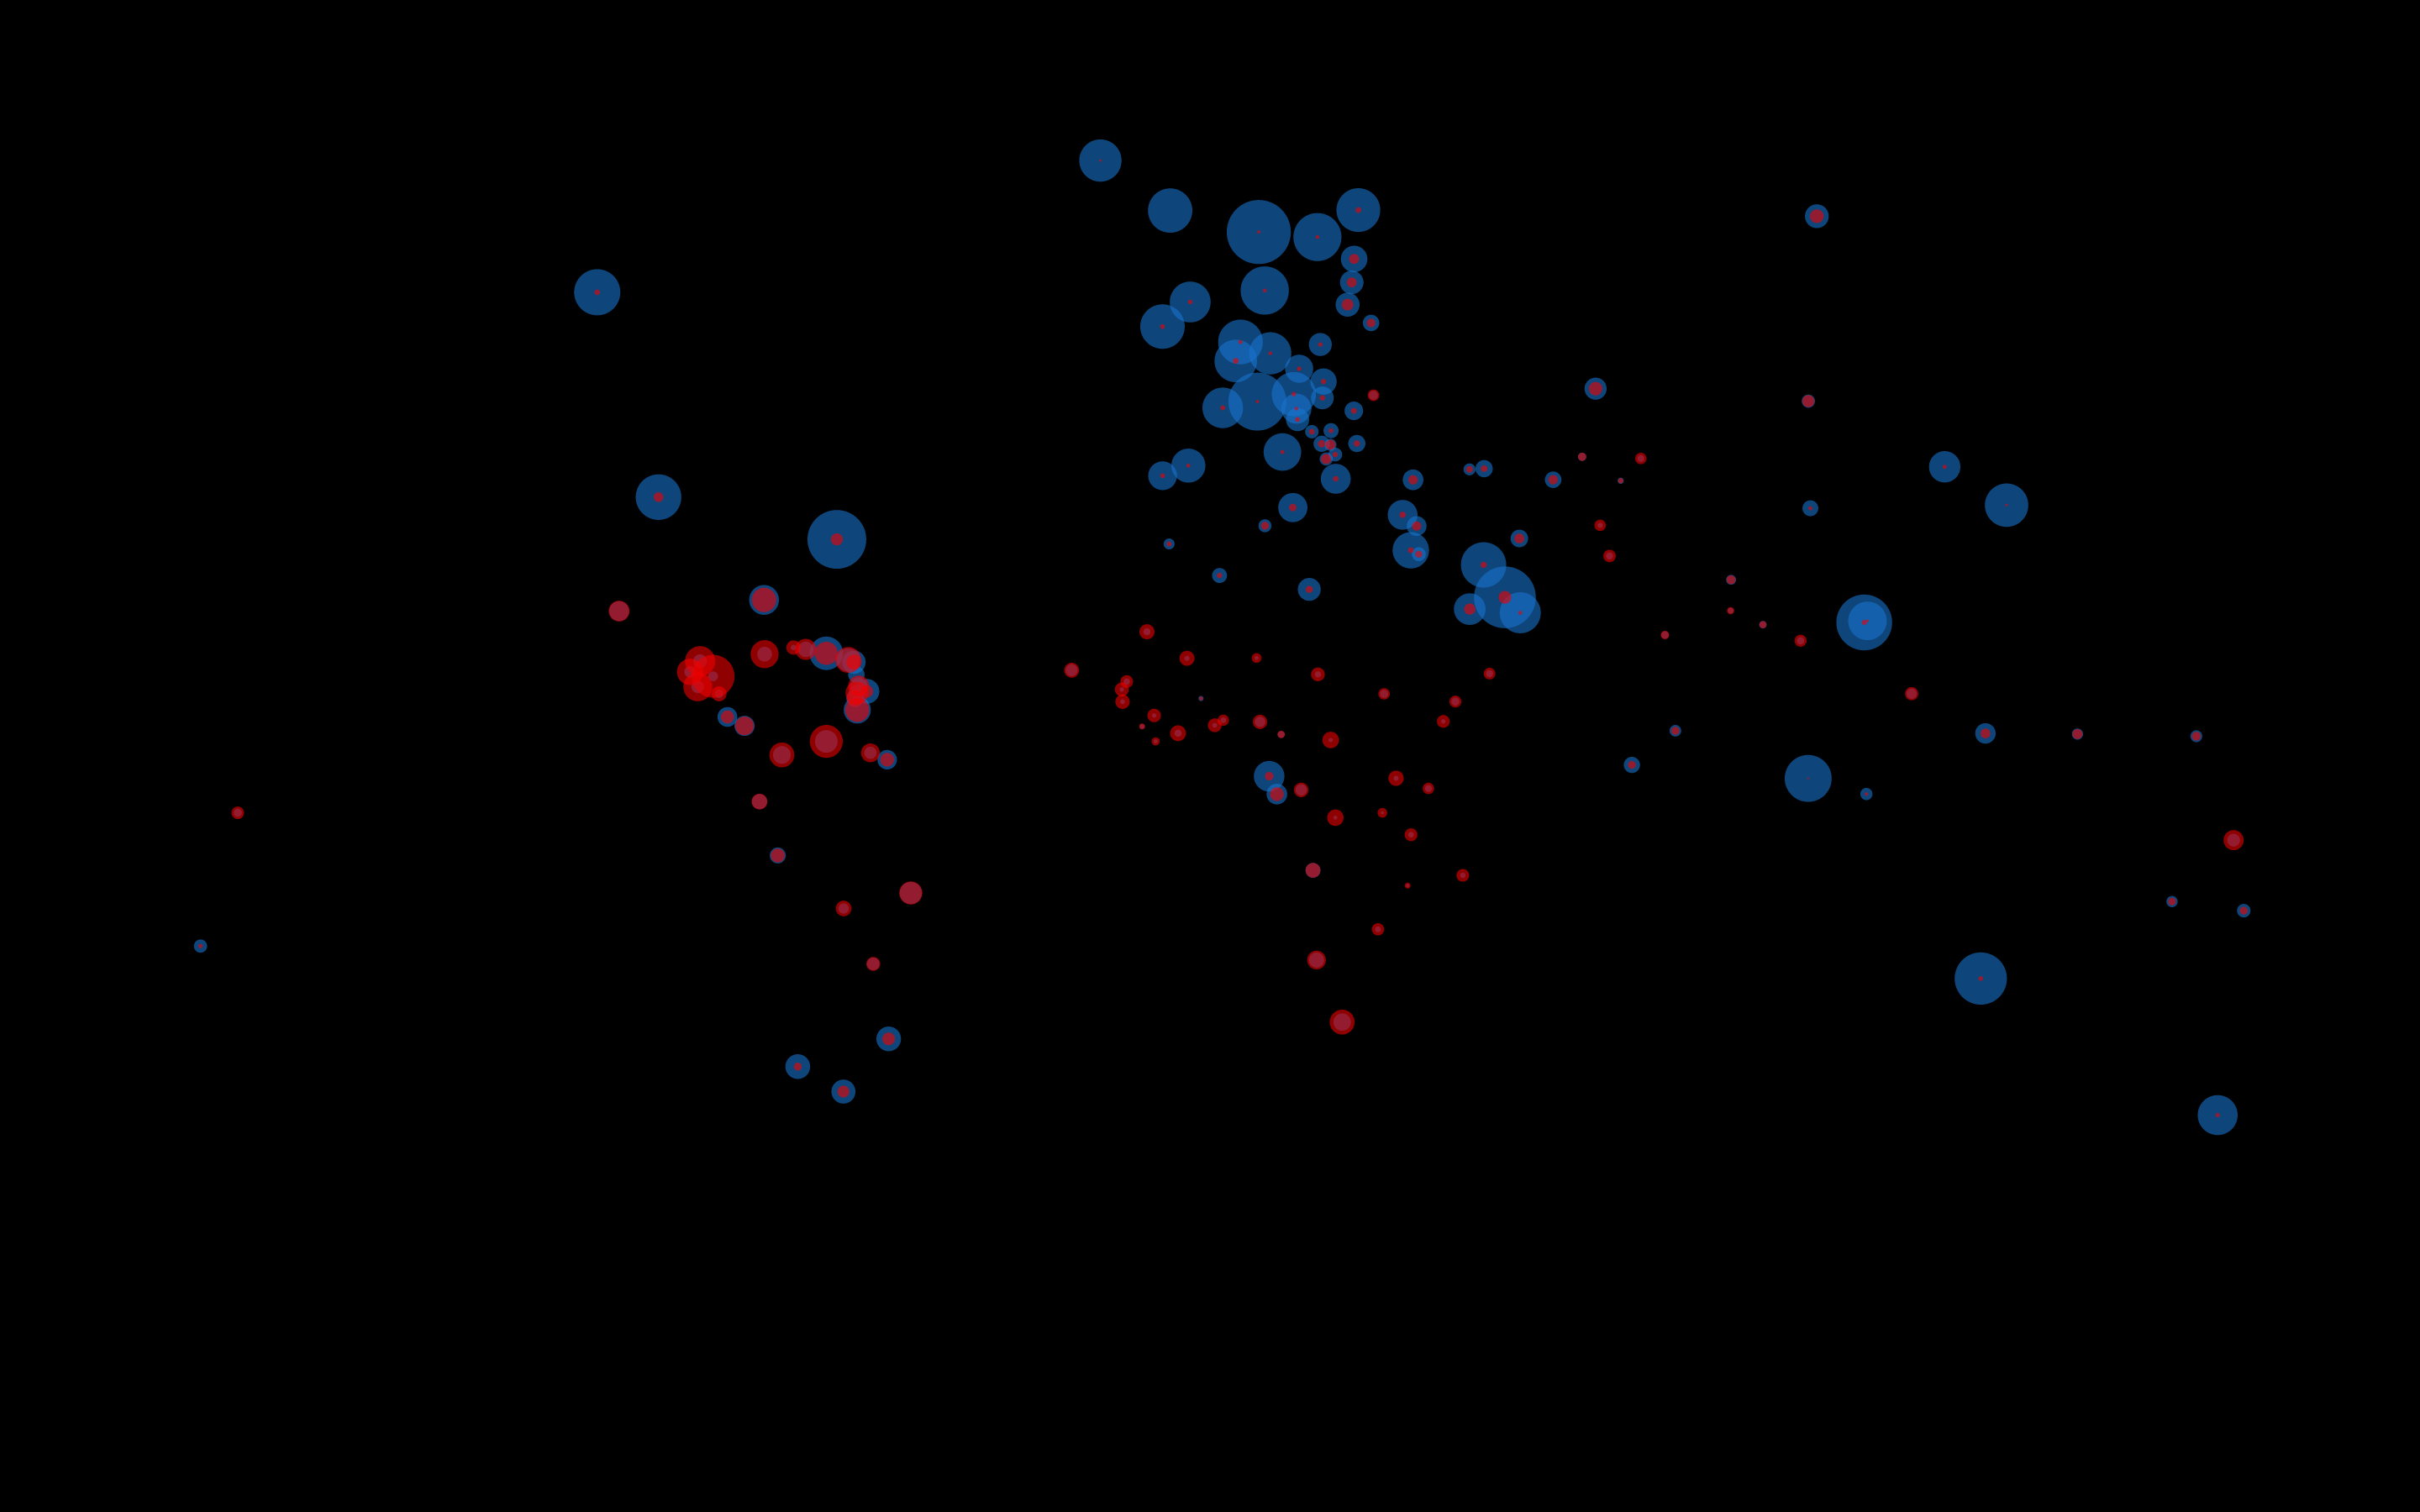
Every country is different, some are poor and some are rich but people get killed everywhere to give you a overview how rich and criminal some countries are i created a interactive graphic. I collected real geo data and real killing/domestic product statistics, converted them into json files and visualized them on a world map, every circle area written by java script code stands in relation to the real data gathered beforehand.

To give even better insides you can change the graphic and see the riches and dangerous places in the world. Give it a try...
Use the mouse to click on your circle/country of choice, click on as many other one to compare there status.
Use the left arrow key on your keyboard to see witch are the riches countries and press the right arrow to see the places with the highest murder rate. If you like to go back use down key.
         
Prototype click around or use the instructions above
Team

Simon Lutter
lectured by
Prof. Hartmut Bohnacker

Project

Generative Design
2rd Semester Summer 2016
HfG Schwaebisch Gmuend